Incorporating Infographics in eLearning
As instructional designers, we aim to design eLearning courses such that it reduces cognitive overload and gives a sense of accomplishment to the learner.
But what is the secret sauce to create effective eLearning courses?
Declutter the screen with irrelevant images, graphics and heavy on-screen text. And your 50% job is done. Yes, it’s just that. Whether it is custom eLearning, rapid eLearning, mobile learning or even microlearning; Relevancy is the key. And incorporating infographics in eLearning can take your eLearning courses to the next level. In this blog, we will highlight the relevancy of infographics in eLearning.
Why eLearning Infographics Make Sense?
Infographics or Information Graphics – a visual representation of information or data.
Did you know?
“An infographic is 30 times more likely to be read than a purely textual article.”
Infographics are one of the best visual tools to hook learner’s attention and convey message effectively. It presents well chunked content with relevant graphics to help learners understand the content in less time and retain for a longer duration.
Learners scan the infographics and interpret the meaning well, especially the complex data, when compared to other visuals.
Let’s consider the below example.
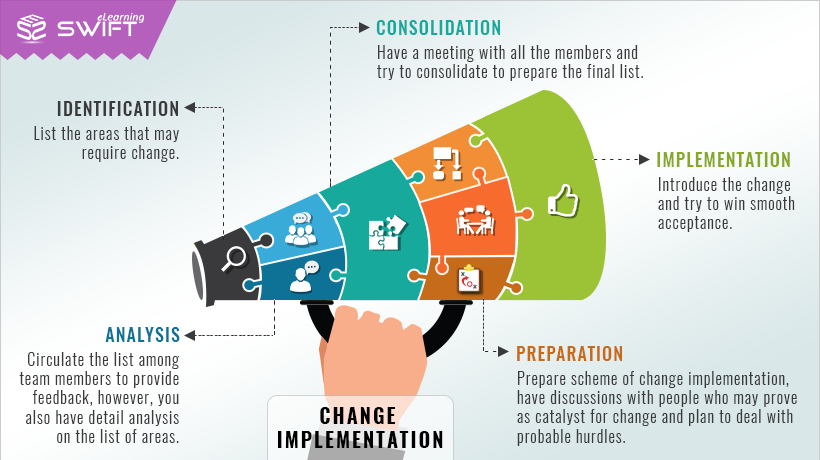
If you closely look at the infographic, large amount of content is broken into small pieces and organized in a meaningful structure with suitable graphical representation.
Incorporating Infographics in Elearning
In eLearning, infographic has a major role to play. It will not enhance the effectiveness of eLearning course, but increases its visual appeal.
Based on a rough estimate, one Infographic may convey the message of three to five eLearning slides loaded with text.
Following are the two greatest advantages of infographics in eLearning:
- It motivates learner with its visually appealing graphical representations
- Significantly reduces number of eLearning course slides
In eLearning, infographic can be made interactive and animated.
Notable Areas Where We can use Infographics
We can use infographics in almost all content types, such as:
- Concepts
- Storytelling
- Comparative Analysis
- Process and Procedures
Infographics Vs Photographs
There is a famous Chinese saying about image, ‘A picture is worth a thousand words; it’s more true for infographics.
Photographs convey unclear meanings – the learner may confuse or may infer different meaning.
Infographics are self-explanatory; the graphic structure and small content nuggets guide learner to the intended meaning.
Tips to Develop Infographics
- Define goal to focus – Keep related and moderate content
- Create scannable content – The graphic structure and content chunks should be skimmable in seconds
- Maintain horizontal flow of content – Learner’s prefer to read left-to-right
- Draw a wire-diagram – Draw high-level structure to plan size and placements of graphic elements and text
- Create graphics – Develop graphic elements; be consistent in shapes and colours
- Avoid large sizes – Try to avoid scrolls
Conclusion
If you want to convey the complex information succinctly and help your learners digest the content easily, then infographics in eLearning should be the best choice.
Our Services: Convert PowerPoint to eLearning, eLearning Translation Services, eLearning Vendor
Leave a Reply
Want to join the discussion?Feel free to contribute!